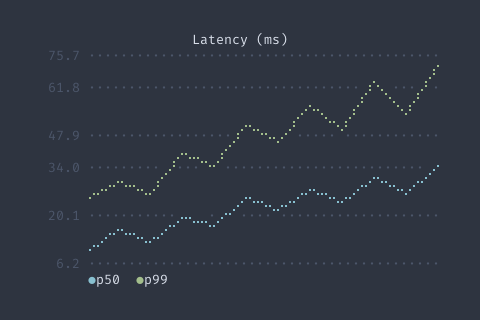
AddSeries | func (g *LineGraph) AddSeries(s DataSeries) *LineGraph | AddSeries appends a data series |
AddValue | func (g *LineGraph) AddValue(value float64, maxLen int) *LineGraph | AddValue appends a value to the first series with rolling window |
Clear | func (g *LineGraph) Clear() *LineGraph | Clear removes all data |
GetFieldHeight | func (g *LineGraph) GetFieldHeight() int | GetFieldHeight returns preferred height |
GetRange | func (g *LineGraph) GetRange() (min, max float64) | GetRange returns the current Y-axis range |
GetSeries | func (g *LineGraph) GetSeries() []DataSeries | GetSeries returns all series |
SetAutoScale | func (g *LineGraph) SetAutoScale(enabled bool) *LineGraph | SetAutoScale enables/disables automatic range calculation |
SetCursorFrac | func (g *LineGraph) SetCursorFrac(frac float64) *LineGraph | SetCursorFrac positions a vertical scrub cursor at fractional X (0..1 across
the plot). A negative value (the default) hides it. Drawn beneath the series
so the line stays visible on top, letting callers correlate a selected point
across stacked graphs. |
SetCursorLabel | func (g *LineGraph) SetCursorLabel(lines []string) *LineGraph | SetCursorLabel sets the plain-text lines shown in a floating card beside the
scrub cursor. Pass nil to hide the card. Drawn on top of the plot, flipping
to the cursor's left when there isn't room on the right. |
SetGridColor | func (g *LineGraph) SetGridColor(color tcell.Color) *LineGraph | SetGridColor sets the grid line color |
SetOnHover | func (g *LineGraph) SetOnHover(fn func(seriesIdx, pointIdx int, value float64)) *LineGraph | SetOnHover sets the hover callback |
SetRange | func (g *LineGraph) SetRange(min, max float64) *LineGraph | SetRange sets fixed Y-axis range (disables auto-scale) |
SetSeries | func (g *LineGraph) SetSeries(series ...DataSeries) *LineGraph | SetSeries sets all data series |
SetShowGrid | func (g *LineGraph) SetShowGrid(show bool) *LineGraph | SetShowGrid enables/disables the background grid |
SetShowLegend | func (g *LineGraph) SetShowLegend(show bool) *LineGraph | SetShowLegend enables/disables the legend |
SetStyle | func (g *LineGraph) SetStyle(style LineGraphStyle) *LineGraph | SetStyle sets the line rendering style |
SetTitle | func (g *LineGraph) SetTitle(title string) *LineGraph | SetTitle sets the graph title |
SetValues | func (g *LineGraph) SetValues(values []float64) *LineGraph | SetValues sets values for a single series (convenience for single-line graphs) |
SetXAxis | func (g *LineGraph) SetXAxis(config AxisConfig) *LineGraph | SetXAxis configures the X axis |
SetYAxis | func (g *LineGraph) SetYAxis(config AxisConfig) *LineGraph | SetYAxis configures the Y axis |